



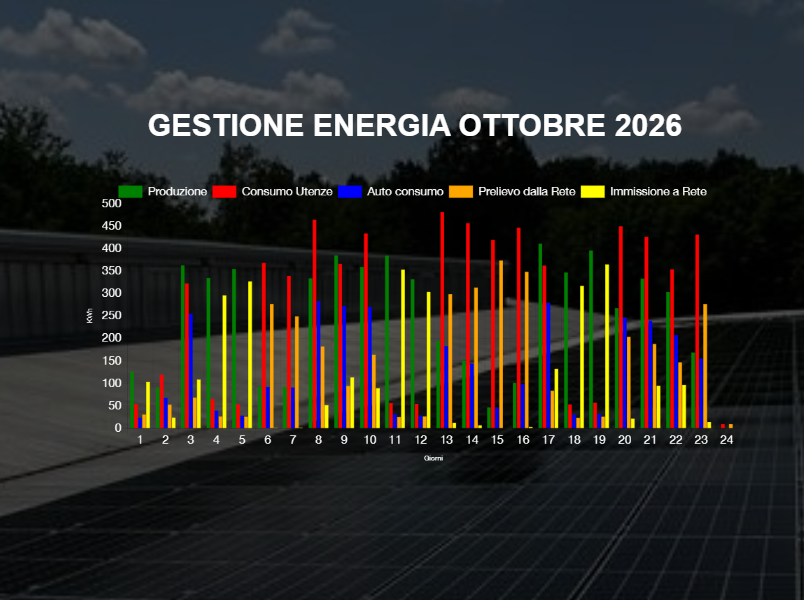
MyEnergy Italy, an established renewable energy and solar EPC firm managing commercial and industrial photovoltaic portfolios across Italy, required a specialized multi-screen operations, telemetry, and energy management portal. Their distributed solar infrastructure blends Huawei SmartPVMS (FusionSolar) inverters with Meteocontrol VCOM dataloggers. We engineered a centralized 8-screen monitoring portal featuring secure, tokenized dynamic routing by PV Plant Code, delivering real-time energy flow analytics and environmental metrics in sub-200ms.
<180ms
Chart Query SpeedDual-API
Huawei + MeteocontrolTokenized
PV Code URL AccessDynamic URL Routing by PV Plant Code
Each solar park is provisioned with a unique, encrypted PV Plant Code. Once granted access, plant owners, maintenance teams, and corporate off-takers can immediately inspect their dedicated installation via a personalized URL (e.g., /portal/{pv_plant_code}). The middle tier verifies the code token and isolates data queries to that specific facility, preventing cross-tenant data leaks without requiring tedious manual account setups.
8-Screen Architectural Breakdown
The application interface is structured into 8 modular telemetry views designed for both operational oversight and corporate ESG (Environmental, Social, and Governance) reporting:
Screen 1 & 2: Real-Time Power & Environmental Impact
- PV System Identification: Dynamic header binding the specific PV Plant Name, geographic coordinates, and active system status.
- Energy Data KPIs: Instantaneous active power (kW), cumulative daily generation (kWh), and lifetime total energy production (MWh).
- Environmental Impact Algorithms: Real-time automated carbon calculations displaying total metric tons of Carbon avoided (t), equivalent trees planted, and avoided CO₂ emissions (e.g., 16 t Carbon, 27 Trees, 20 t CO₂ avoided).
Screen 3 & 8: Energy Balance & Grid Management
- Current Month Balance: Segregates solar generation into on-site self-consumption vs. green energy exported directly to the national grid network.
- Utility Consumption Matrix: Evaluates total facility energy draw, showing the exact ratio powered by on-site solar vs. withdrawal from the electrical grid.
- Total Lifetime Energy Management: Long-term aggregate analytics tracking historical self-consumption efficiency and net grid reliance since plant commissioning.
Screen 4 & 5: Granular Production Curves
- Production Today (Screen 4): High-resolution 5-minute interval time-series curve showing active power ramp-up, peak solar noon generation, and inverter clipping thresholds.
- Production Current Month (Screen 5): Daily aggregated bar charts tracking daily yield (kWh) against expected monthly irradiation baselines.
Screen 6 & 7: Macro Annual & Lifetime Production
- Production Current Year (Screen 6): Month-over-month yield comparisons illustrating seasonal generation swings across Italian summer and winter periods.
- Total Production History (Screen 7): Multi-year production trends monitoring long-term photovoltaic panel degradation and inverter performance degradation rates.
Backend Engineering & Data Caching
To power these 8 interactive screens without triggering third-party rate limits, the system operates on a decoupled data pipeline:
- Synchronized Ingestion Workers: Background cron worker daemons poll the Huawei SmartPVMS and Meteocontrol VCOM APIs at 5-minute intervals, handling token refresh cycles and payload sanitization automatically.
- Indexed Time-Series Storage: Relational MySQL tables use composite indexes on
(plant_code, metric_type, timestamp), allowing multi-year chart queries to render in under 180ms. - Client-Side Chart Optimization: Optimized
Chart.jsintegration with responsive canvas rendering, enabling smooth tooltips and multi-metric axis toggles on mobile, tablet, and desktop screens.
Business Value Delivered
The centralized portal eliminated fragmented vendor logins, automated environmental reporting, and delivered an executive-ready dashboard for MyEnergy Italy’s clients. Daily operational inspection times dropped by 65% while maintaining zero API quota violations.